Monday, September 3, 2012

Copy-paste optimization in creating array of shapes


Assume that you are using a painting/diagraming software and you’ve created certain shape (in our example it is just a square). Also, assume that you want to array this shape for 100 times in one row and the software does not support arraying. So, what are you going to do in this case? Are you going to draw the shape for another 99 times? Or are you going to copy the drawn shape and paste it 99 times? Or what?

I thought about this problem and found that I can copy the original shape and paste it x times to create a group of shapes, then I’m going to copy the group and paste it y times to get the final array. Consider the following example and figure in which we want to create an array of 10 squares. There are many solutions like the following:


Solution

Number of copy-paste/redrawing operations after drawing the original shape

Draw the square 10 times

9

Draw the square once, copy once, and paste it 9 times

9

Draw the square once, copy it, and paste it once. Now, you have a group of two squares; copy the group and paste it 4 times (1)

5

Draw the square once, copy it, and paste it twice. Now, you have a group of three squares; copy the group and paste it 2 times. Finally, copy the square and paste it once. (2)

5

Draw the square once, copy it, and paste it 3 times. Now, you have a group of four squares; copy the group and paste it once. Finally, copy the square and paste it twice. (3)


6

Draw the square once, copy it, and paste it 4 times. Now, you have a group of five squares; copy the group and paste it once. (4)

5


So, given those solutions, what is the optimum or minimum time consuming solution. This is the aim of this post. This method can be used for both linear and circular arrays. As we noticed in the previous table that there may be many optimum solutions. In the previous example the minimum number possible of operations is five.


The following relation governs the copy and pasting by groups


To find the best size of the group (number of elements in one group) we should calculate the number of operations for each value ranging from 1 to the half of array size. For extremely large arrays, you may need to construct the group itself using this method.

At the end, I want to say some thing … I’m using Microsoft Office Visio as the drawing/diagraming software and it –in fact- supports two dimensional arraying, but I used this method before I have knew that it does.
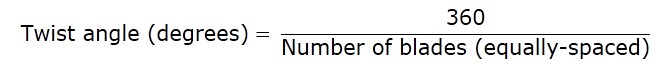
The other thing I want to say is that I think that this method is going to be very useful for those who want to create a helical Savonius blade die using discrete (very thin) elements. In this case, you should know blade’s height and specify the thickness of the element and so you get number of elements by division of the previous values.

Helical Savonius, axis of twist and axis of rotation

In a simple Savonius wind turbine there are two types of gaps between the buckets that can be specified based on the design requirements: the primary gap and the secondary gap, but it was common to set the secondary gap to zero. In our graduation project, we were asked to create a two-bladed helical Savonius VAWT (90 degrees twist angle) with different values of the primary gap to know the best dimensionless value (gap distance divided by bucket diameter) of the primary gap that gives highest power coefficient. We thought about creating two helical (twisted) blades and then use them with different primary gap values by sliding them in or out on a straight line (as the same method you can think about when you want to change the primary gap for a conventional Savonius). Since we were in the brain storming phases and not taking what we were saying seriously, we didn’t release that this was a mistake. When we tried to draw the cad model of the blades and bottom and top caps to just test how to draw the blades in Autodesk Inventor, we got assembly errors with a large exclamation mark on our faces !!!!. After a wise thinking we found that we should create a couple of blades for each value of the primary gap. To understand why we reached this conclusion, let’s consider the following figure that shows two cases:

§  In the first case: the axis of twist coincides with the axis of rotation. Therefore, the primary and secondary gaps are constant for all sections of the blade. Simply, axis of rotation, axis of twist of the first blade, and axis of twist of the second blade are coincident.
In the second case: the axis of rotation does not coincide with the axis of twist and the axes of twist of both blades also don’t coincide. In other words, we have 3 axes at different locations. Taking the bottom edge profile (buckets) as a reference, we will find that we increased the primary gap and the secondary gap is zero. Moving up along the axis of rotation, we will find that the values of the primary and secondary gaps are changing from section to section. So, for this reason, the turbine will not perform the same at different phase angles.


Thursday, August 30, 2012

Methods of obtaining uniform (smooth) torque in Savonius wind turbine


In this post, I’m going to discuss the different methods and ideas to get a uniform torque through the whole revolution (cycle) of Savonius or any drag type VAWT. Some of these methods can be applied and the other may be only theoretical.
Consider the following relations to extract all the available methods to obtain a smoother torque operation.


1.   Using helical (twisted) profile Savonius

The common two-bladed Savonius wind turbine with 180 degrees angle of twist (like helix® wind turbine) will produce a uniform torque through the whole cycle. This method is the best method –till now- to smoothen torque. This method looks like placing a large (infinite) number of conventional Savonius turbines with infinitesimal height one above another, and each turbine is angularly-shifted (rotated about axis of rotation). Theoretically (as I claim, and neglecting the effect of top and bottom tips), a general relation which relates number of blades with angle of twist may be used:

Considering a Savonius bucket (semi-circular) element with infinitesimal height, the previous relation (formula) came from the fact that we want -at any angular position of the turbine- to find buckets with phase angles ranging from 0 to 360 degrees. Or more precisely, and in other words, for any angular position of the turbine we want to find blade patterns ranging from 0 to 360.


Note: increasing number of blades has certain limits. Performance of wind turbine deteriorates at high number of blades. Also, the geometry of the blade constrains the maximum number of blades.
2.   Variable radius (force arm)
In this method, the blade will slide out/in from/to the center of rotation in order to compensate decrease/increase of aerodynamic force to get a uniform torque through the whole cycle. In fact this method is completely idiot because it has the following disadvantages:
§  This method will work properly –theoretically- for only one wind direction (and its opposite direction), and so the main advantage of VAWT of receiving wind from any direction with the same performance is no more available

§  Sliding motion in and out is going to change the primary gap between inner blade tips which affects heavily the performance and noise level of the turbine

§  This method requires a complex mechanism (based on the mathematical model of the aerodynamic force) to give a variable radius. In most cases, aerodynamic force does not change linearly with angular position.

§  The use of certain mechanism will limit the RPM of the turbine and make it more noisy and difficult to maintain.
3.   Variable drag (projected) area
As a concept, it looks like the previous method. In this method we increase/decrease the area of the blade (in drag type VAWT) as the torque arm decreases/increases. This method also has the same disadvantages of the previous method. When drag area increases/decreases in a radial direction, torque radius also is going to increase/decrease and this is how two methods can be combined in one.
4.   Variable blade profile
It is some kind of foolish to think about this method, but it is just an option to imagine. In this method we change blade profile and so drag coefficient as the blade rotates. Blade profiles with high drag coefficients will be used at smaller torque radii, and vise versa. In addition to the disadvantages of methods 2 and 3, a changing blade profile may be considered as a science fiction as it is impossible to achieve.
5.   Controlling inlet wind speed
In fact, inlet wind speed can be controlled with different methods based on the imagination of the designer, but I’m going to assume that a flat shield plate is used to do this job. Controlling the angle of this shield plate is going to affect and control air speed over the advancing blade. The control of shield plate angle may be achieved by using stepper/servo motor or by linking the shield plate with the rotor by a mechanism to update plate angle passively without the need of external control. This method requires some setup for a given (fixed) wind direction, and this makes the turbine no more useful when wind comes from another directions.
6.   Controlling rotational speed of the wind
By controlling rotational speed of the turbine at different angular positions, we can control the relative velocity of air with respect to blades. At positions of high torque values increase turbine’s rpm, and at the positions of low torque values decrease turbine’s rpm.
7.   Changing inlet wind direction with time
When blade rotates, deviate the direction of inlet air keeping its speed the same.
As the turbine revolves, change the inlet wind direction in order to make the turbine exposed to the same aerodynamic force for the whole cycle.
8.   Controlling inlet air density
This method also is just an imagination in a science fiction movie. In this method increase/decrease air density when torque arm decreases/increases. Air density may be controlled by spraying a water mist in the inlet air (just imagine).
9.   Array of Savonius wind turbines with angular (phase) shift
Imagine a linear array of simple Savonius wind turbines that are connected (linked) using a large belt or sprocket chain, and this belt drives a central generator. Also, imagine that those turbines have different phase angles for a given wind direction. Although this method requires a farm of wind turbines, and has many disadvantages like the use of belts or chains, positioning problems of these turbines, and not-operating with the same performance for all wind directions, but it conceptually works.


Sunday, August 26, 2012

Mesh quality measures for 2d meshes


Mesh quality measures for 2d meshes

There are several methods to measure the quality of a mesh element (cell). The quality of a cell is measured with respect to a reference element (cell) that is claimed to have the best quality. The reference element is dependent on the application where this mesh is going to be used. Therefore, there is no absolute definition of mesh quality. Considering the applications of multi-physics simulation, the mesh elements (cells) are required to be almost uniform. For a 2d case, the triangular cell is required to be an equilateral triangle, the quad element is required to be a square, and so on. The following are some techniques to measure mesh quality:

1.   Minimum angle criteria

Quality is measured based on a predefined optimum value of minimum angle.

2.   Maximum angle criteria

Quality is measured based on a predefined optimum value of maximum angle.

3.   Perimeter and area criteria

The quality is measured as the ration between the square of perimeter divided by the area of the element. This method is suitable for any polygon element. An additional advantage is that this method can be used for mixed-element meshes.

4.   Inscribed and circumscribed circles criteria

In fact, this method can be used only with triangular elements. The quality is defined as radius of the circumscribed circle divided by radius of the inscribed circle.

5.   Perimeter and edge ratio criteria

This method also is used only for triangular elements. For any cell compute the perimeter and divide it by number of edges of the cell to get edge length of the uniform polygon having the same perimeter (reference edge length). Then get the ratios of edge lengths to the reference edge length. Finally, compute the arithmetic average of these ratios to get the quality of this cell.

6.   Edge ratio criteria

Used for triangular cells. Quality is the ratio of longest edge length to shortest edge length

Tuesday, August 14, 2012

Scilab Graphic Editor Improvement

Hey guys, I've utilized my little TCL-TK programming experience and done many improvements to the graphic editor of Scilab. The major improvements are:

1. Converting most of the widgets (buttons, check buttons, radio buttons, scroll bars, combo boxes, labels, frames, entries, label frames, notebooks) to themed widgets, which means the graphic editor will obtain the same look and feel of your operating system (windows, linux) or you can apply the themes available by Ttk. I didn't change the scales used for setting colors and sizes, and the object browser tree.

2. The original code contained a lot of unnecessary frames and paned windows which made the heirarchy of the GUI difficult to understand and resource-consuming

3. Removed some code lines that were unimportant

4. Add some features for colormap selection, plot rotation angles, arc entities

5. A lot of useful comments added to the original files to help in future improvement and development

6. Changing the annoying icon of Tk with a Scilab-representive icon

7. Adding all supported fonts in the operating system in GED which makes graph labels and text easily-customizable. These fonts are listed in a combo box with auto complete feature to pick up quickly your favorite font.

8. Interacitve entries, most of the entries can be scrolled by mouse wheel to decrease or increase values inside with the proper increment.

9. Scrollable scales. By just hovering over the scale and scrolling up or down the scale is scrolled.

11. Axis label position was represented by one entry in which you should write a row vector inside. Now, the position of axis lable is represented by two scrollable entries for interactive horizontal and vertical movement.

12. It was not possible to set negative rotation angle for axis label. Now, you can set the rotation angle with negative values.

13. Setting colormap of the figure is made easy buy replacing the old entry used as a command line by a combo box containing list of colormaps and an entry to set number of colors in the colormap.

The following capture shows how the graphic editor looks like after the modifications. I hope that Scilab developers will embed my modifications to Scilab in the next version. If you need the modified files and the installation method, just contact with me via comments.


And the following capture is taken when I tested the new graphic editor after modifications in windows xp (as you can see, the GUI is xp looking).


Sunday, August 12, 2012

Scilab console keyboard shorcuts

The following table shows some keyboard shortcuts used in Scilab as mentioned in Scilab help:


UP or Ctrl+P
Recall previous line in command history list
DOWN or Ctrl+N
Recall next line in command history list
F1
Call Scilab help.
F2
Clear console.
F12
Open console box only on Windows.
Ctrl+Space or TAB
Completion: Scilab displays a list of all names that start with some characters.
Ctrl + A or HOME
Move to beginning of current line. This is useful for long code lines.
Ctrl + B or LEFT
Moves the cursor one character to the left.
Ctrl + C
Interrupts Scilab if nothing selected in the console, else text selected is sent to clipboard.
Ctrl + D or DELETE
Deletes the current character.
Ctrl + E or END
Moves the cursor to the end of command line.
Ctrl + F or RIGHT
Moves the cursor one character to the right.
Ctrl + H or BACKSPACE
Deletes the previous character.
Ctrl + K
Kills command line from cursor to the end.
Ctrl + S
Select all.
Ctrl + U
Delete the whole command line.
Ctrl + V
Do a paste from clipboard.
Ctrl + W
Delete the last word of the command line.
Ctrl + X
Interrupt Scilab
Ctrl + LEFT
Move left one word.
Ctrl + RIGHT
Move right one word.
Shift + HOME
Select from cursor to beginning of statement.
Shift + END
Select from cursor to end of statement.
Double-click
Select current word.

In fact, most of these shortcuts is rarely used, but there is a great shortcut that a lot of Scilabers don't know about Scilab, this shourtcut is "TAB" or "Ctrl+Space" which is used for auto-completion of Scilab Syntax. The list of auto-completion displays all the functions, variables, macros, files, and graphic properties that start with the written characters. When there is no suggestions for the written characters then the shortcut will return nothing, and when there is only one suggestion then Scilab will auto-complete using this suggestion. This shortcut also works in the Scipad. The following caption shows how the auto-completion popup list looks like.

I don't know what was the first version of Scilab introducing this auto-completion popup list, but I tried it in Scilab 5.3.3 (0).

Tuesday, July 31, 2012

Some remarkable difference between matrix and list in Scilab

When comparing Scilab with C++, we will find that matrices in Scilab are equivalent to arrays in C++ and lists in Scilab are equivalent to structures in C++. Lists (data structures) are preferable when creating a database or when a set of data has no specified layout. The following points are some differences between matrices and lists in Scilab:
§  Matrix elements must be all of the same type (.i.e. matrix of strings, sparse matrix, polynomial matrix, real matrix, ... ) , while the list can store different types of elements like numbers, strings, matrices, sparse matrices, polynomial, functions, ... and for this reason lists (typed lists) are implemented in graphic window properties, axes properties, entity properties, and ... etc. in Scilab as it contains mixed types of data, like the following:

Figure property
Type
Type No.
Children Matrix of graphic handles 9
Figure position Real row vector of size  1 x 2 1
Figure size Real row vector of size  1 x 2 1
Axes size Real row vector of size  1 x 2 1
Auto resize Matrix of character strings 10
View port Real row vector of size  1 x 2 1
Figure name Matrix of character strings 10
Figure ID Real matrix 1
Info message Matrix of character strings 10
Color map Matrix of size M x 3, where M is number of colors and 3 is the RGB channels 1
Pixel map Matrix of character strings 10
Pixel drawing mode Matrix of character strings 10
.
.
.
.
.
.
.
.
.

For example, you can use lists to create a data base for employees and this data base contains the following data:
     Employee name (string)
     Employee age (real matrix)
     Employee salary (real matrix)
     Employee is married or not (Boolean)
     Employee notes (empty in case there are no notes)


§  Number of elements in each row in a matrix is the same, while in lists each row (entry) can has different number of elements

§  Matrix can't store an empty row while list can do